Debug options
Debug mode
You can enable debug mode to add is-test field with value of 1 to the settings request, as well as to add debug field with value of true to analytics requests.
PAAnalytics.enableDebugMode()
You can also disable it with:
PAAnalytics.disableDebugMode()
Realtime Debugging
We offer some ways of debugging your events. For one, you can enable or disable direct send. By default it's disabled. When enabled, logged event/attribute will be sent immediately without waiting for the batch size to reach the limit, and without waiting for the time interval to pass.
PAAnalytics.enableDirectSend()
And disable it with
PAAnalytics.disableDirectSend()
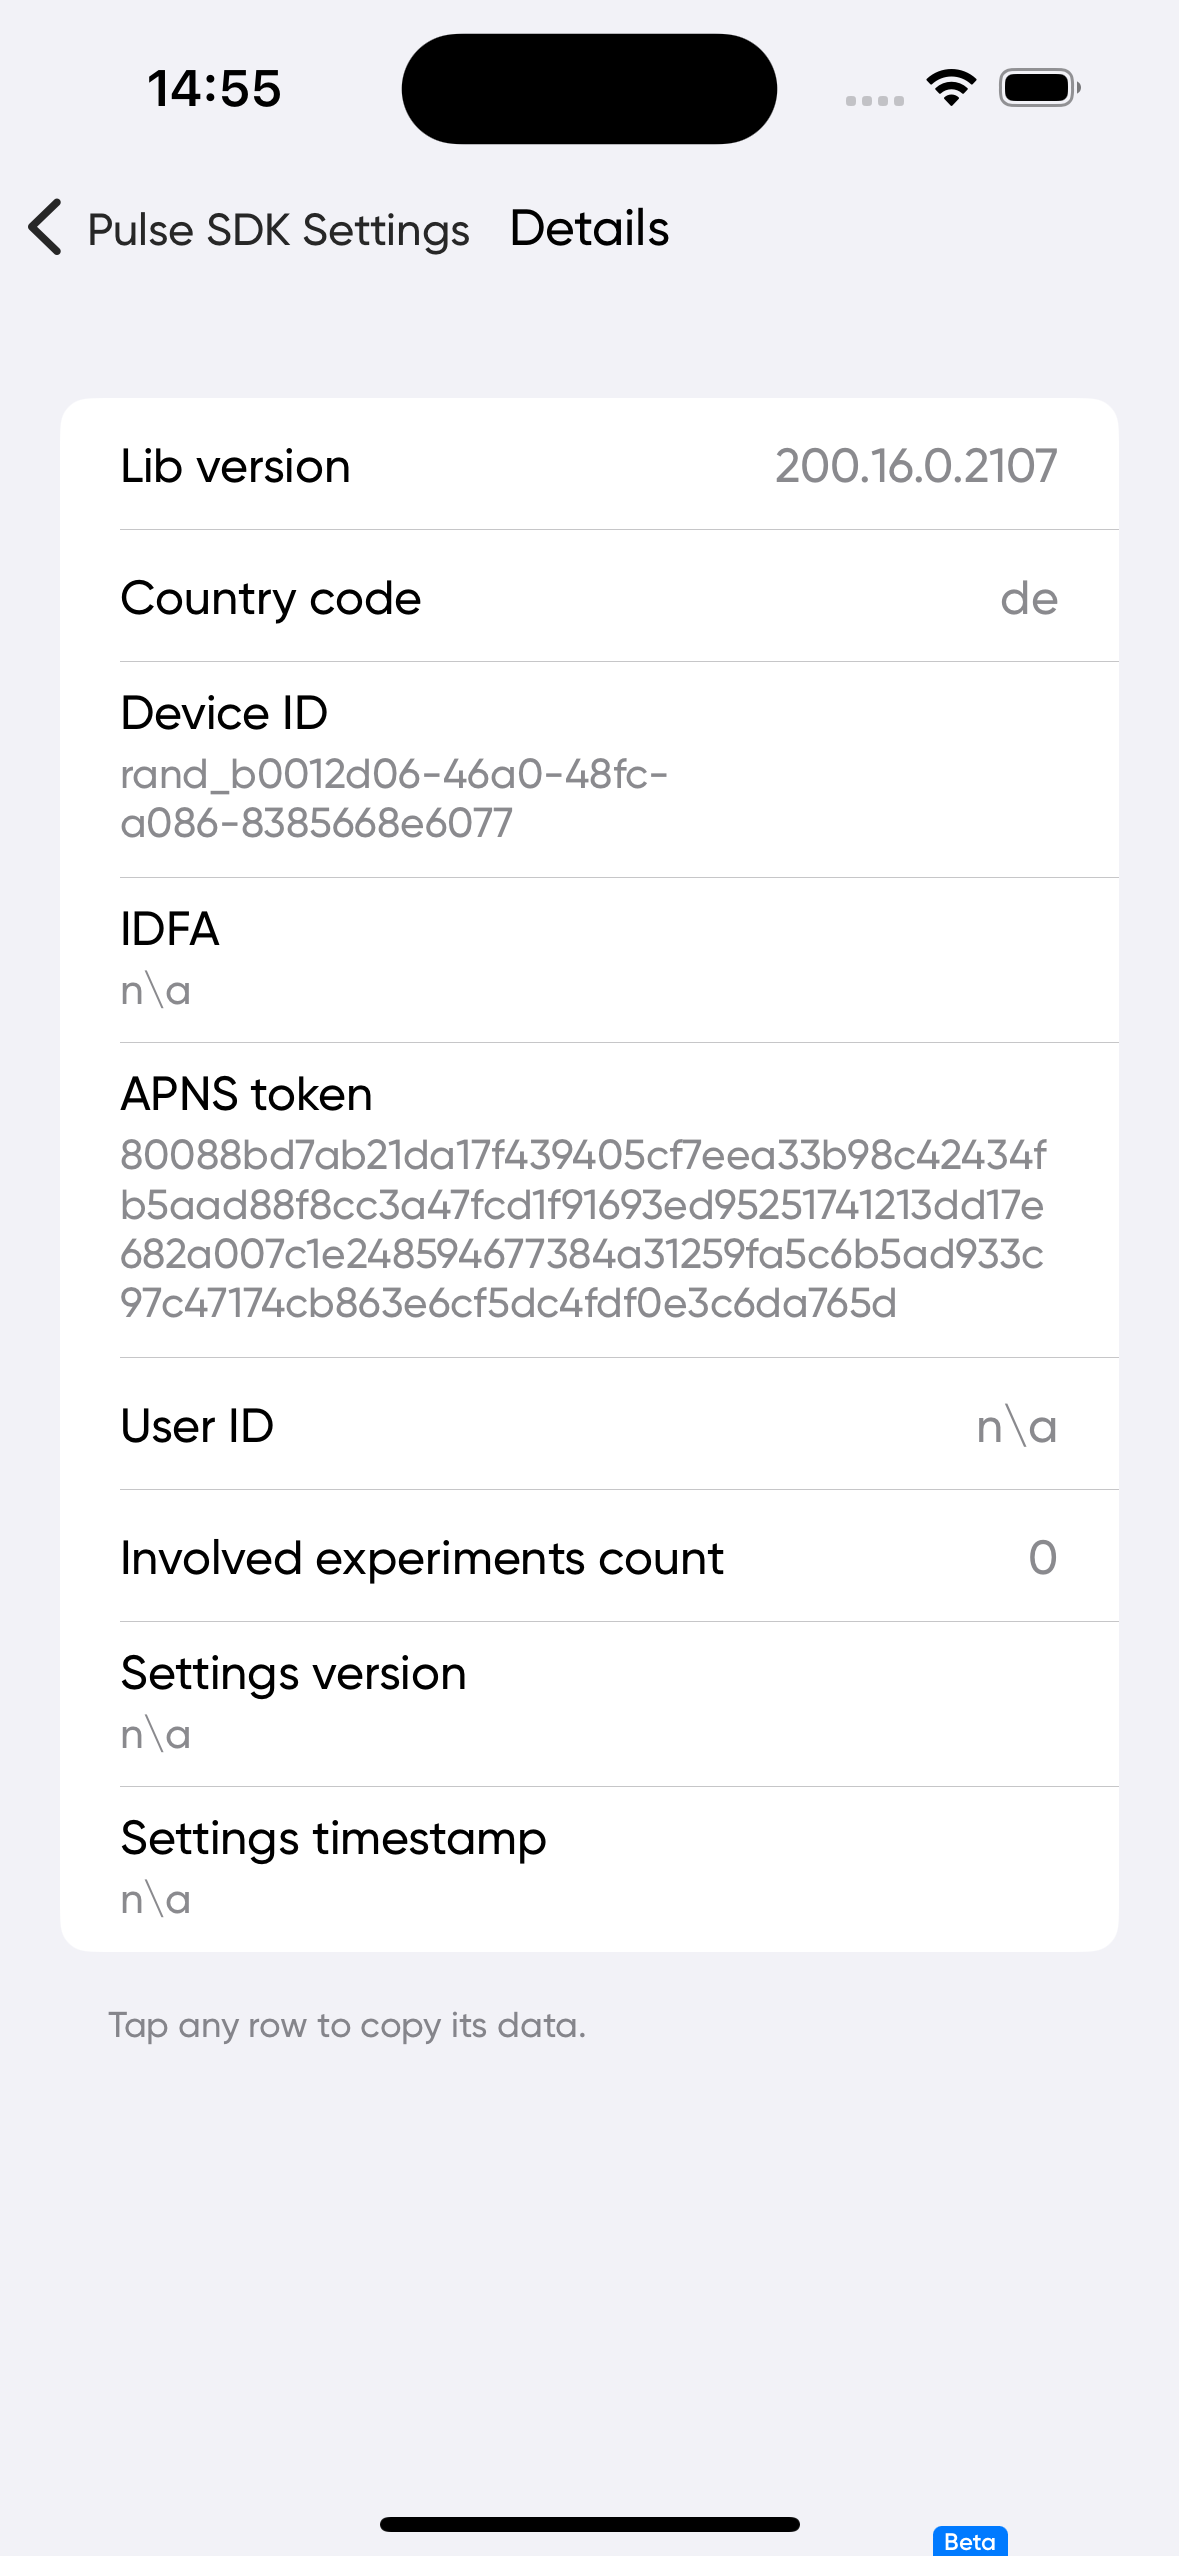
Session Header
The SDK can provide the current session header dictionary, which contains metadata about the active session. This is useful for correlating analytics data, debugging, or passing session context to other services.
if let header = PAAnalytics.sessionHeader {
    print(header)
}
The returned dictionary contains the following fields:
| Key | Type | Description |
|---|---|---|
v | String | SDK version identifier |
app | String | Application bundle identifier |
session_id | String | Unique session identifier |
timezone | String | Device timezone |
user_id | String | Configured user ID |
platform | String | Platform name (e.g. "apple") |
country_code | String | Device country code |
data | Dictionary | Additional device metadata (e.g. device_model) |
market | String | Market identifier |
device_id | String | Unique device identifier |
version | String | Application version code |
debug | Bool | Whether Test Mode (Debug Mode) is enabled |
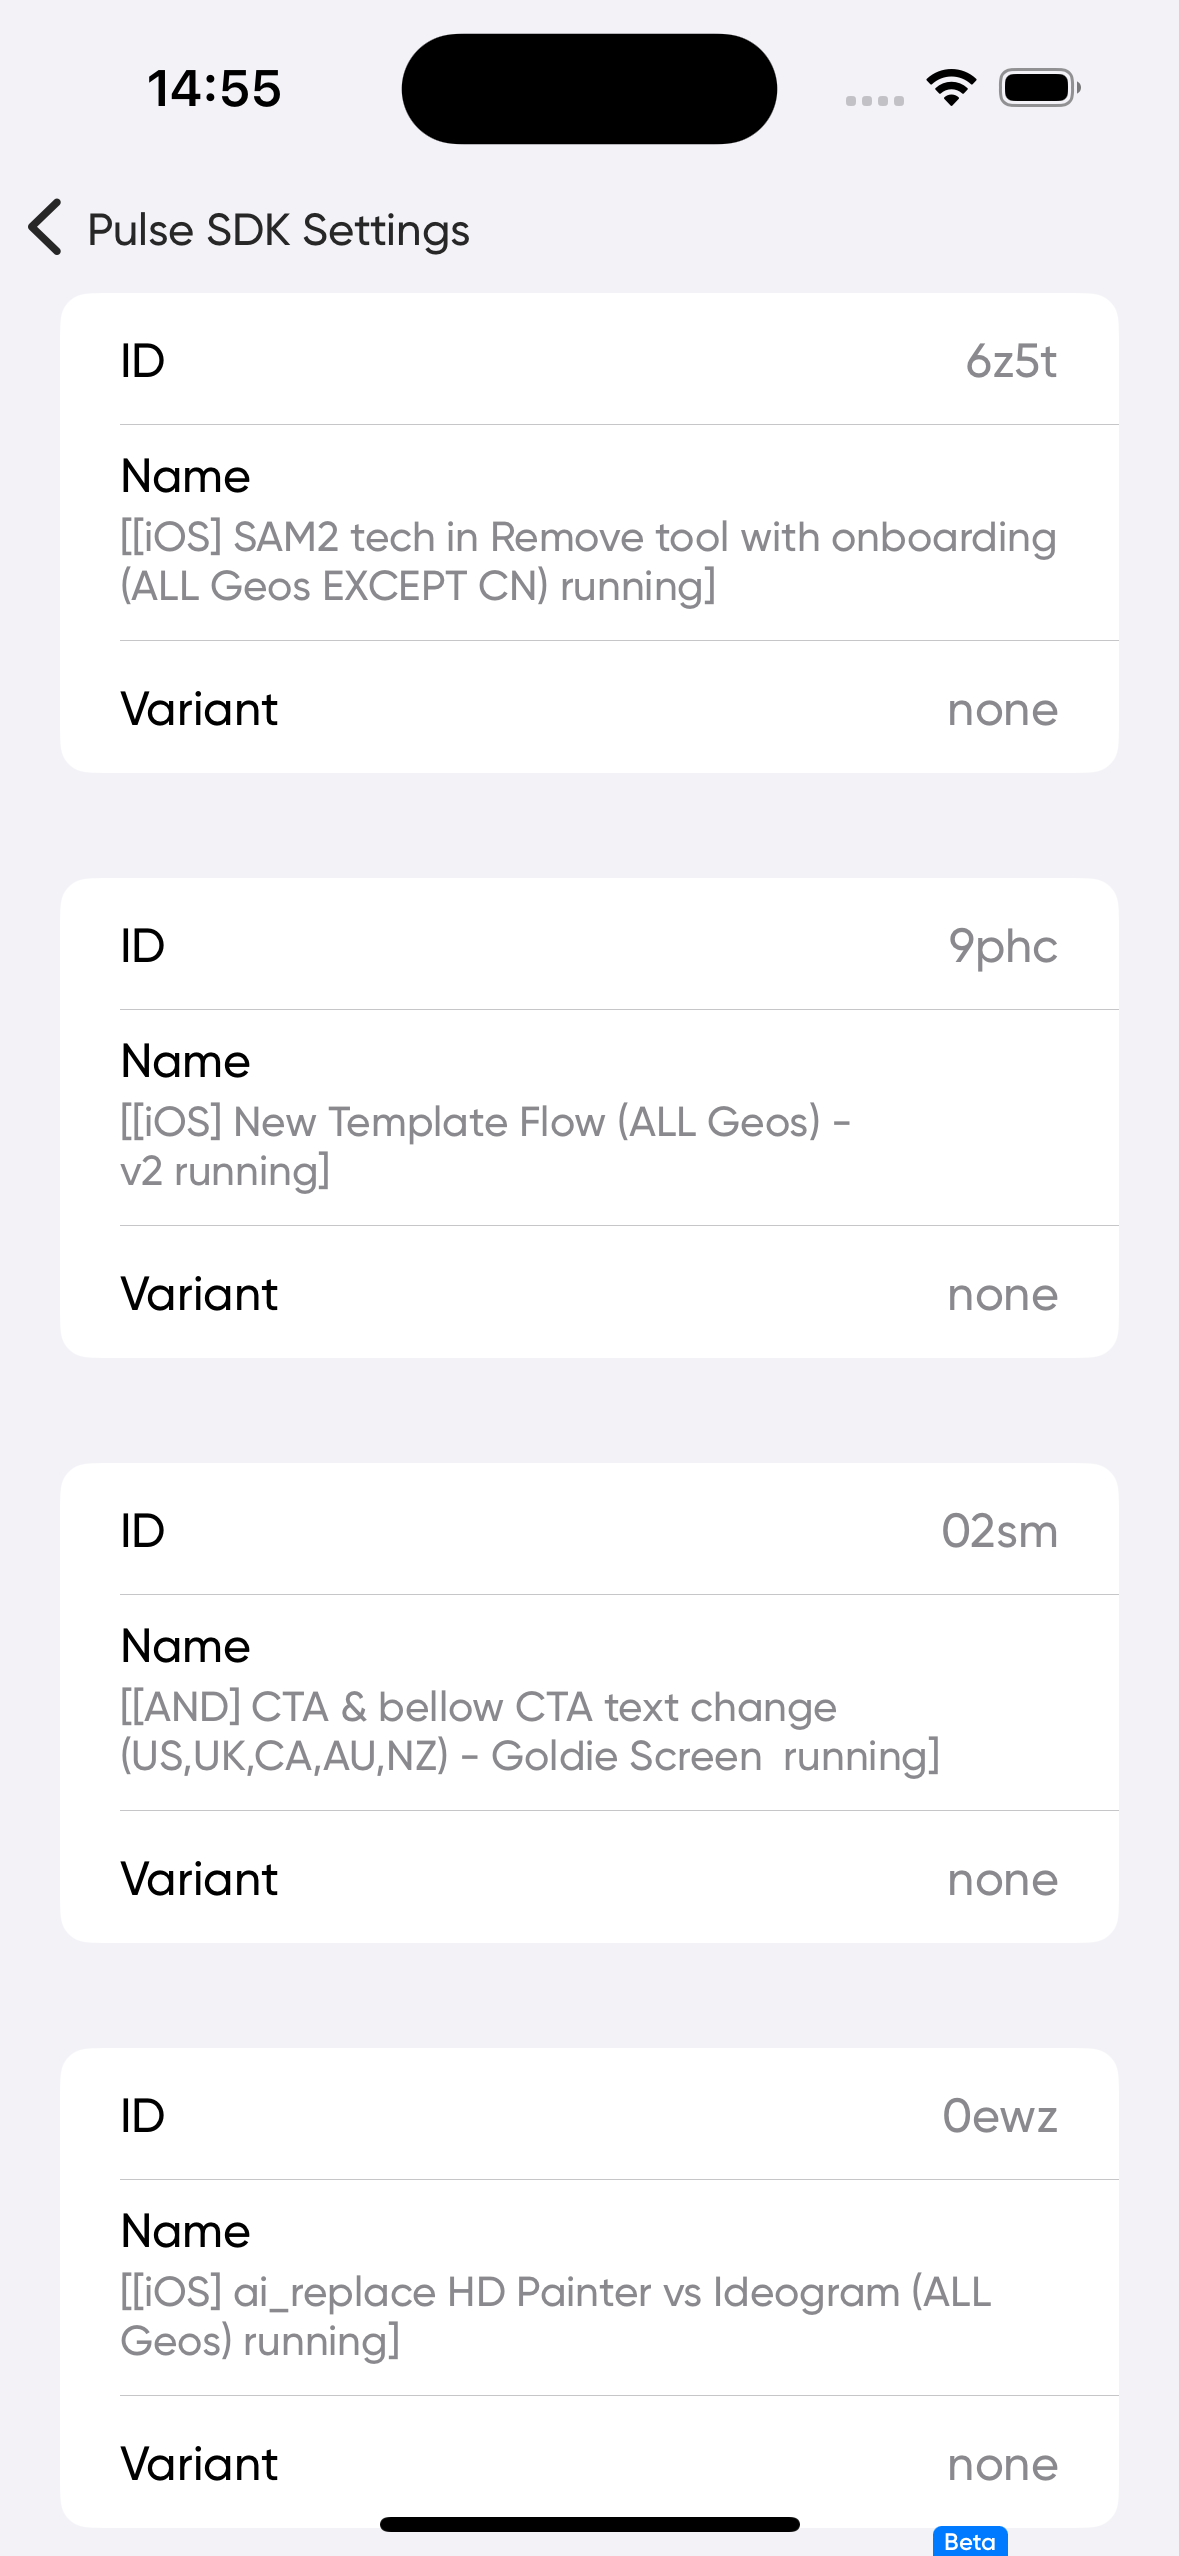
infected | Array | Experiment participation data (present only when active experiments exist) |
Example response:
{
  "v": "300.12.5.2830.1.2830",
  "app": "com.picsart.studio",
  "session_id": "1775550561726_rand_1e470f80-27c7-4350-9877-4b8da4a28be2",
  "timezone": "Europe/Berlin",
  "user_id": "376845868060101",
  "platform": "apple",
  "country_code": "de",
  "data": {
    "device_model": "iPhone 17"
  },
  "market": "apple",
  "device_id": "rand_1e470f80-27c7-4350-9877-4b8da4a28be2",
  "version": "29800",
  "debug": true,
  "infected": [
    {
      "id": "exp_1",
      "variant": "variant_a",
      "participation_session": "participation_session_id",
      "participation_timestamp": 1235678900
    }
  ]
}
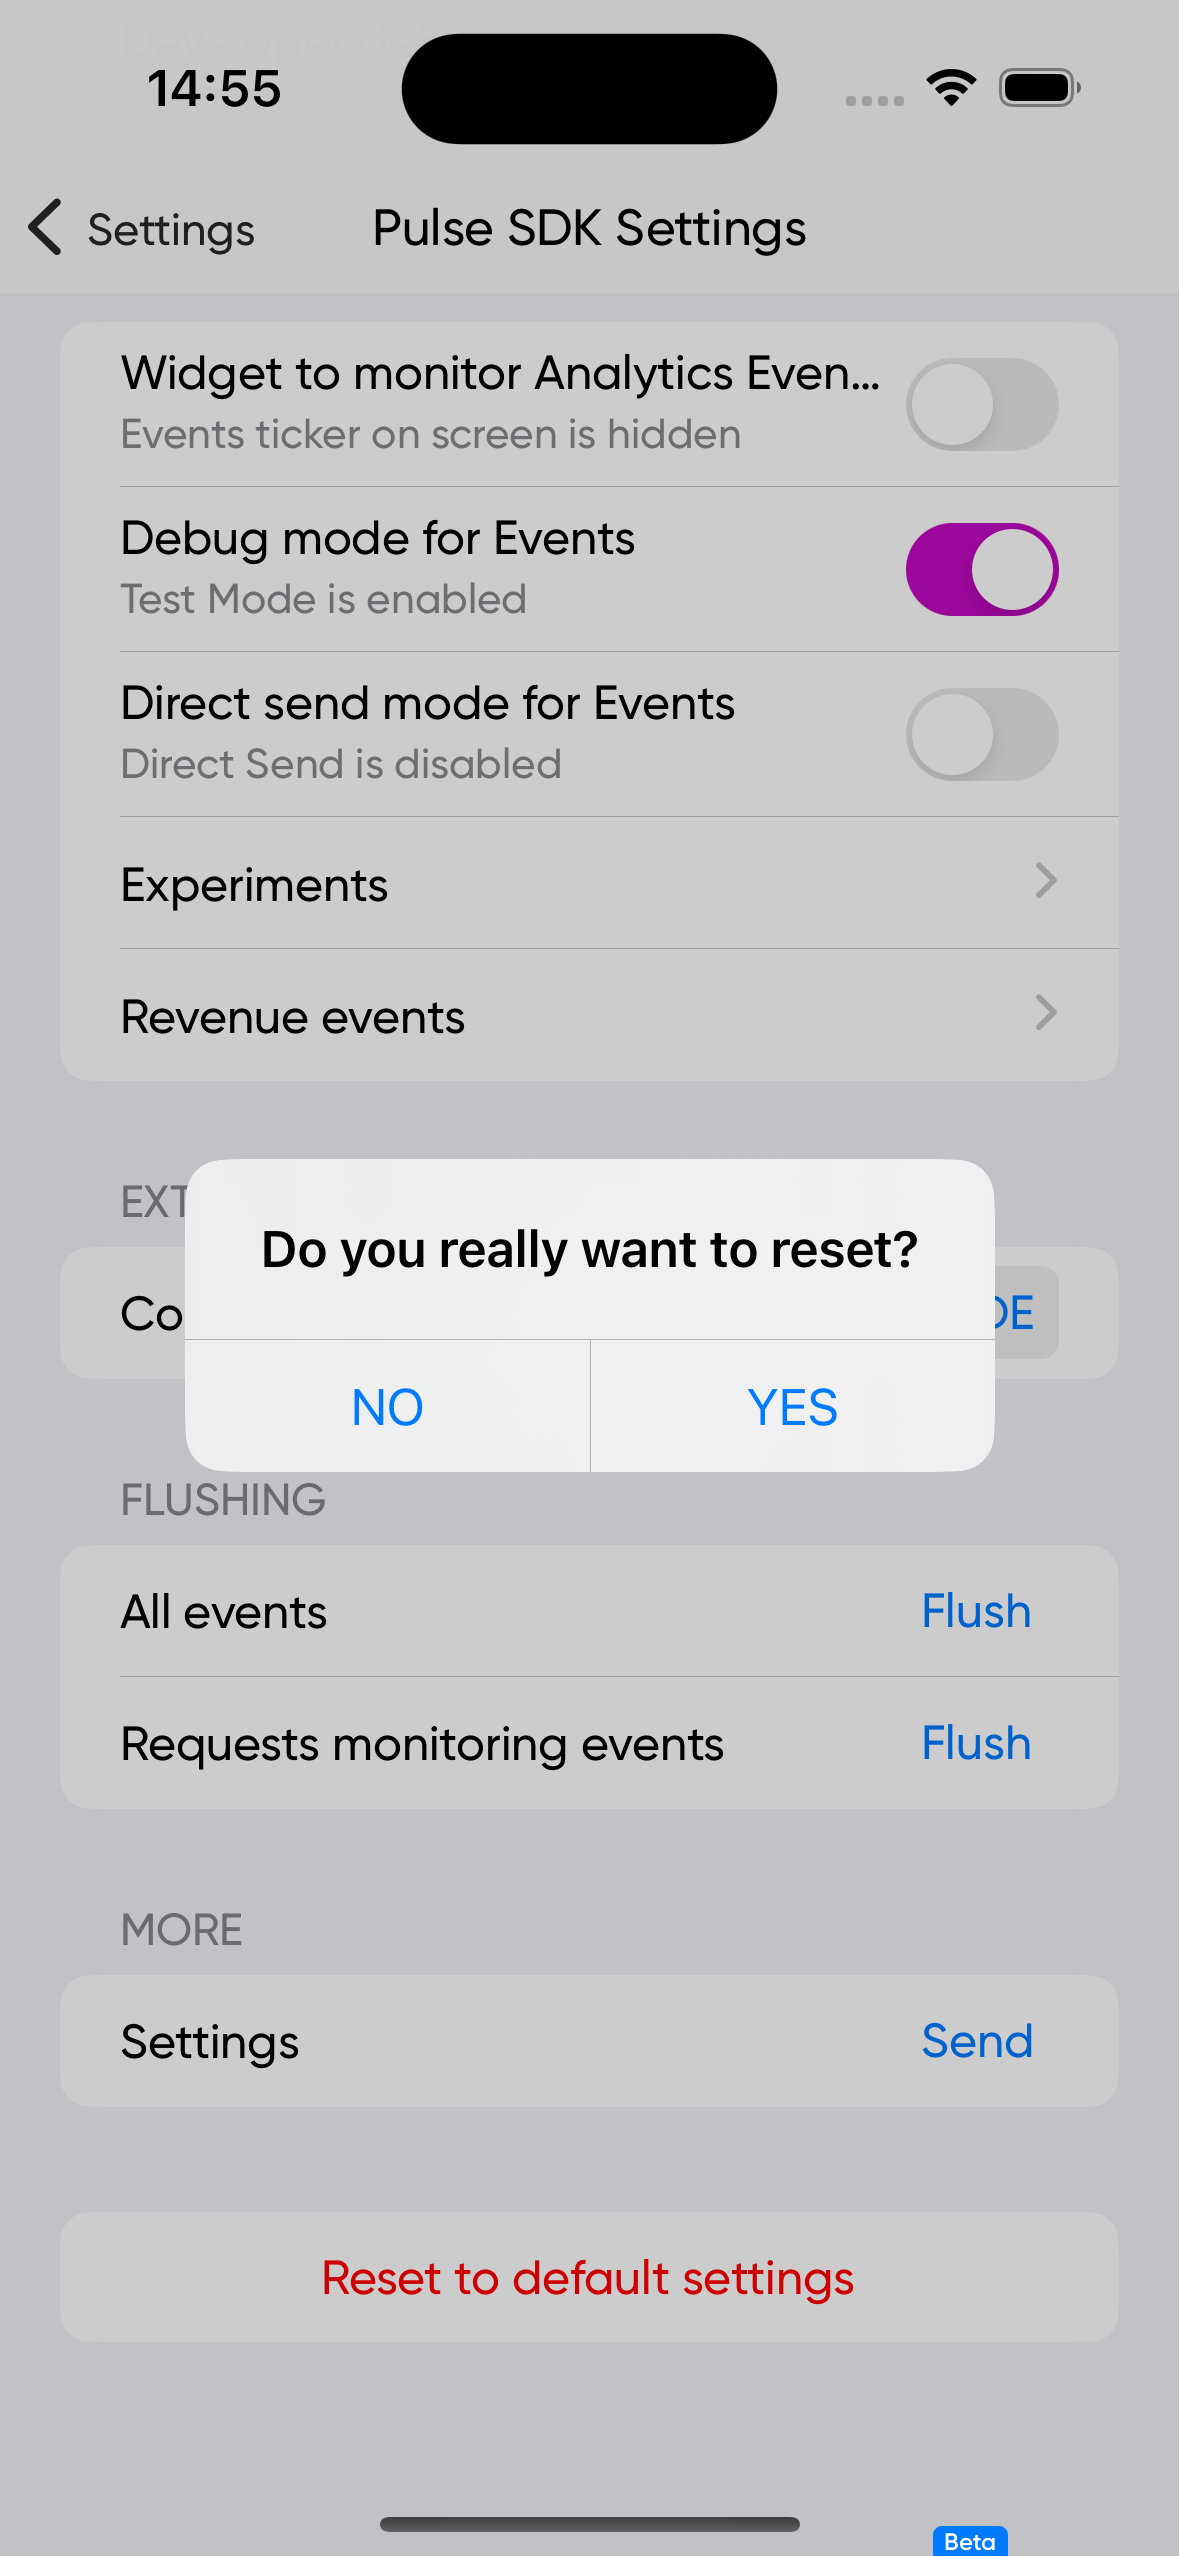
UI Debugging
The Analytics SDK provides a simple UI to facilitate testing experiments and modifying configurations in analytics. You are responsible for presenting it modally or pushing it onto the navigation stack. To obtain a prepared instance of the appropriate view controller, you should call:
PAAnalytics.analyticsDebugUI()
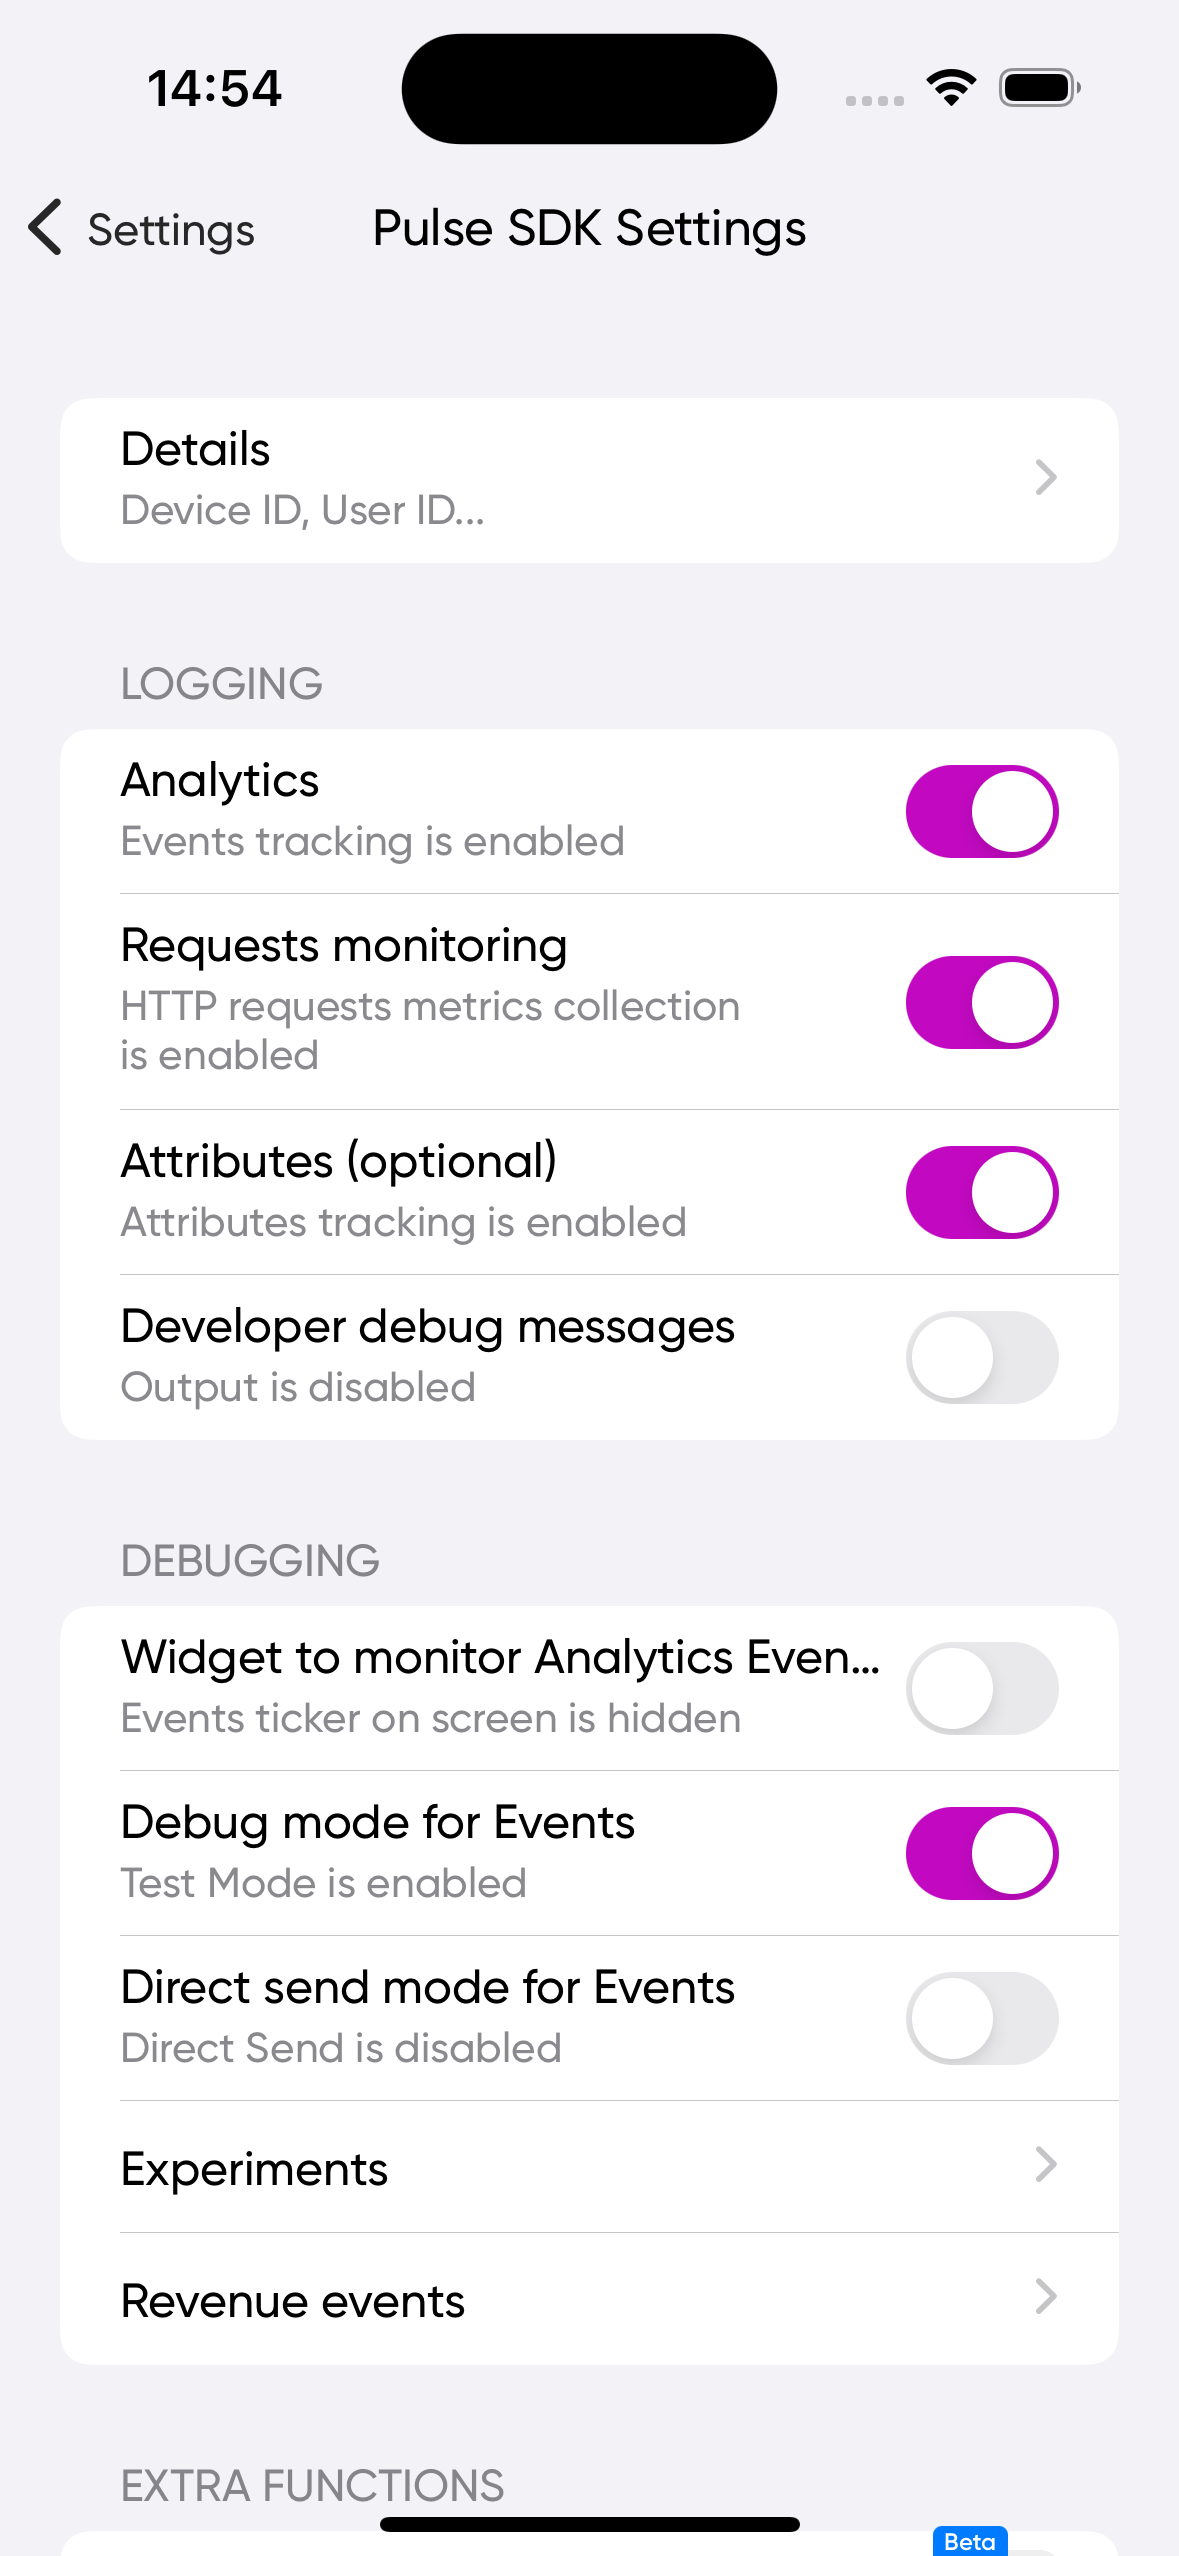 |  |  | 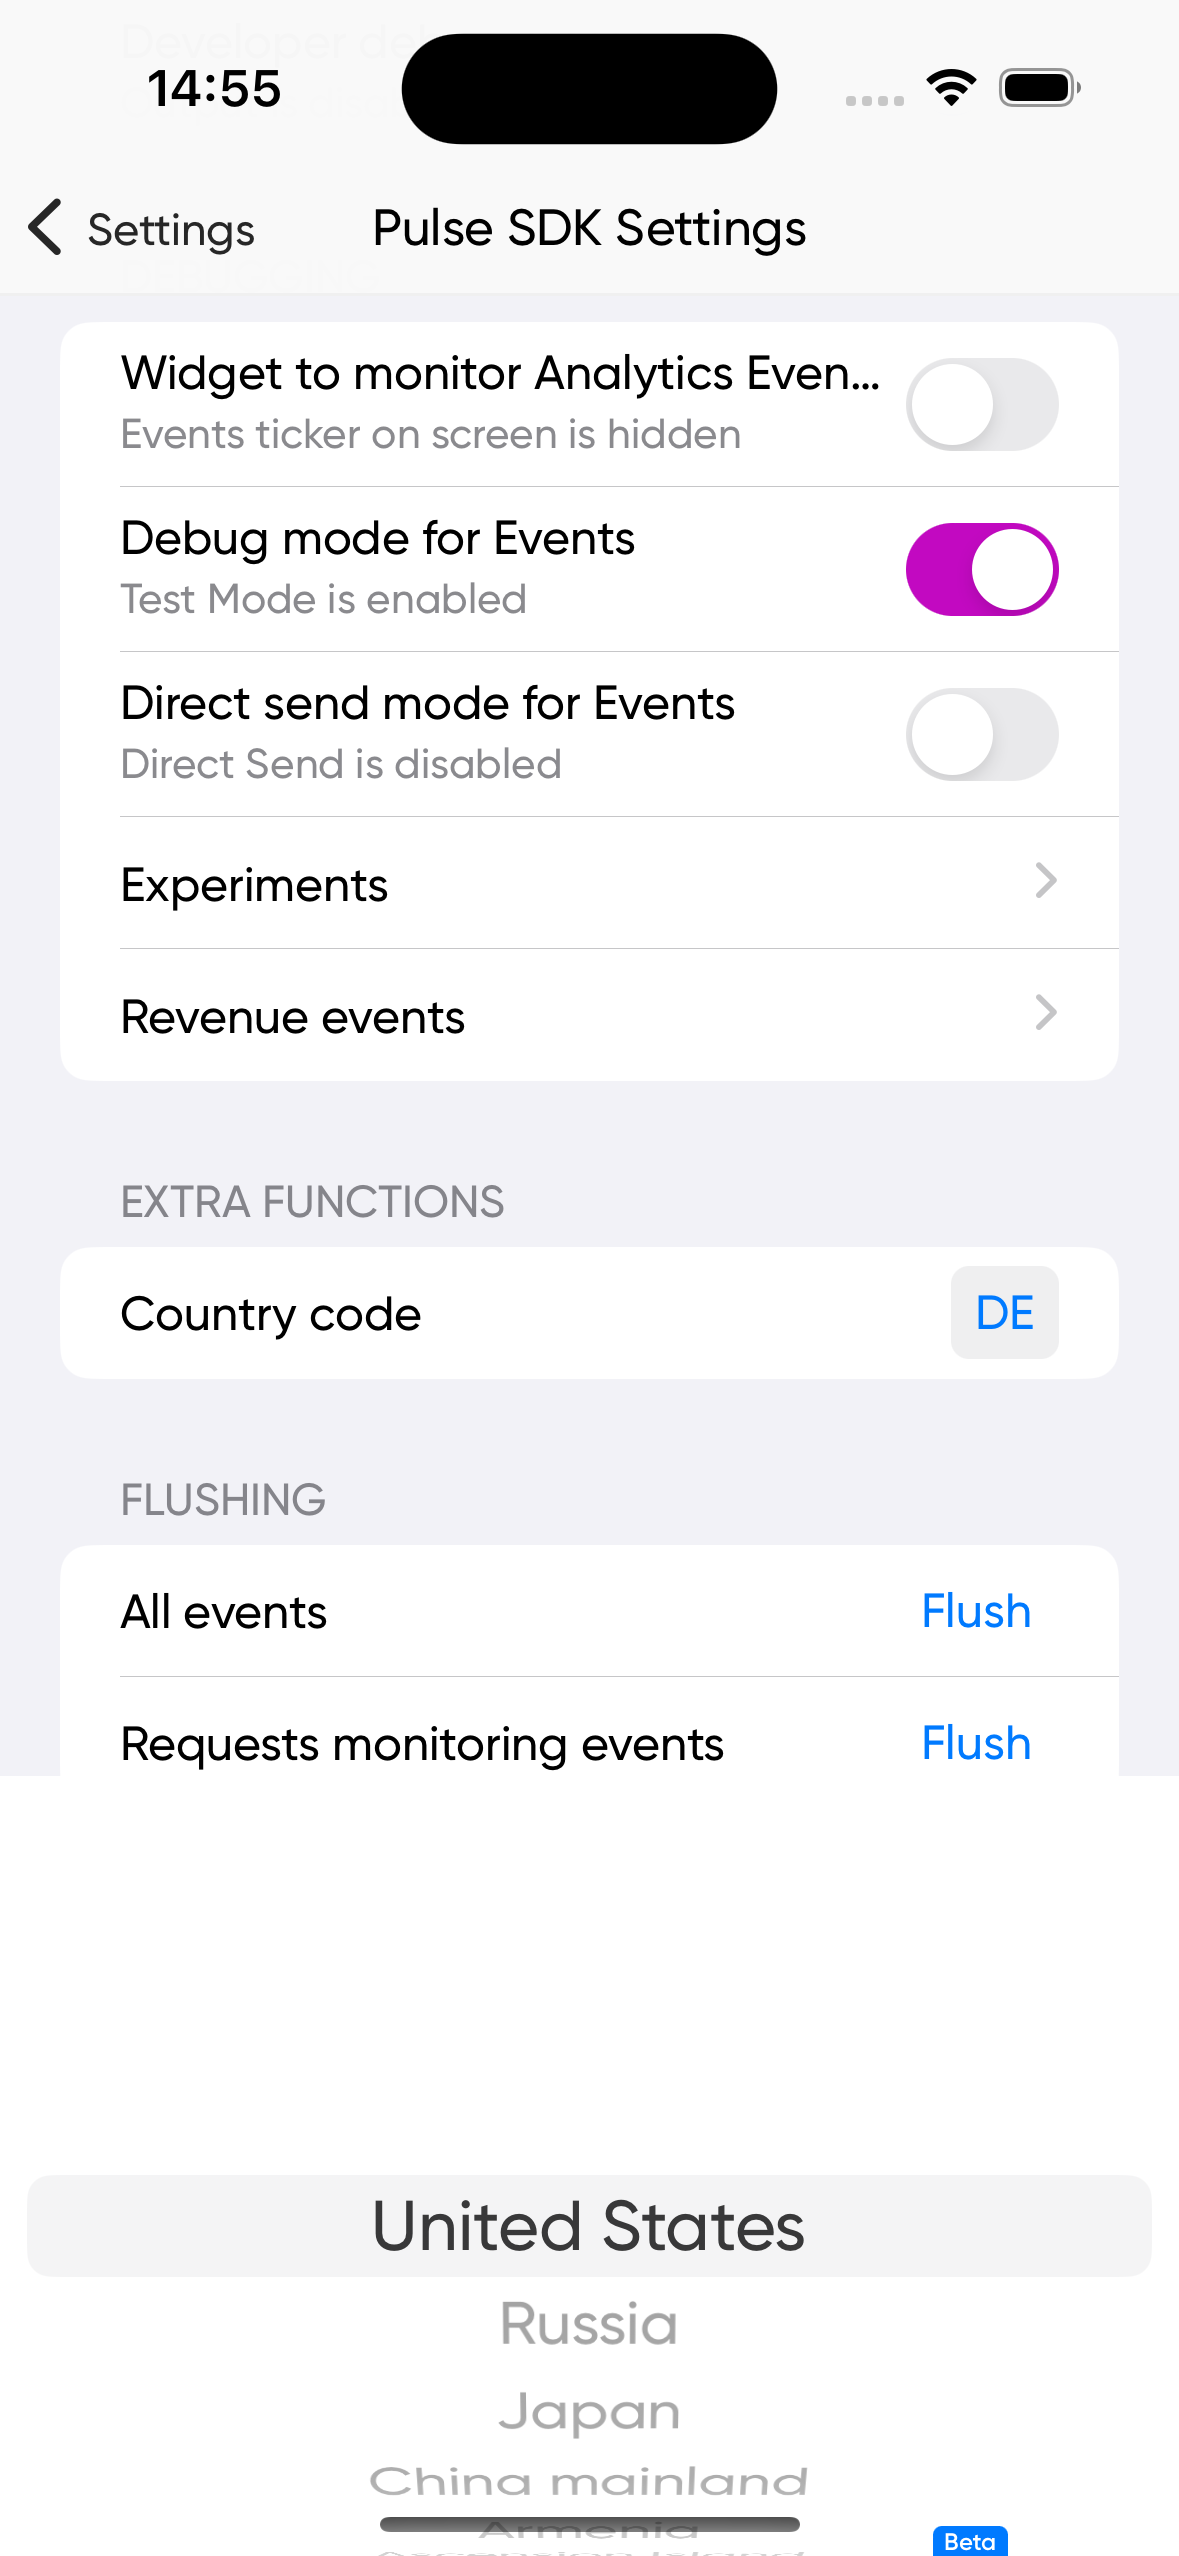 |  |
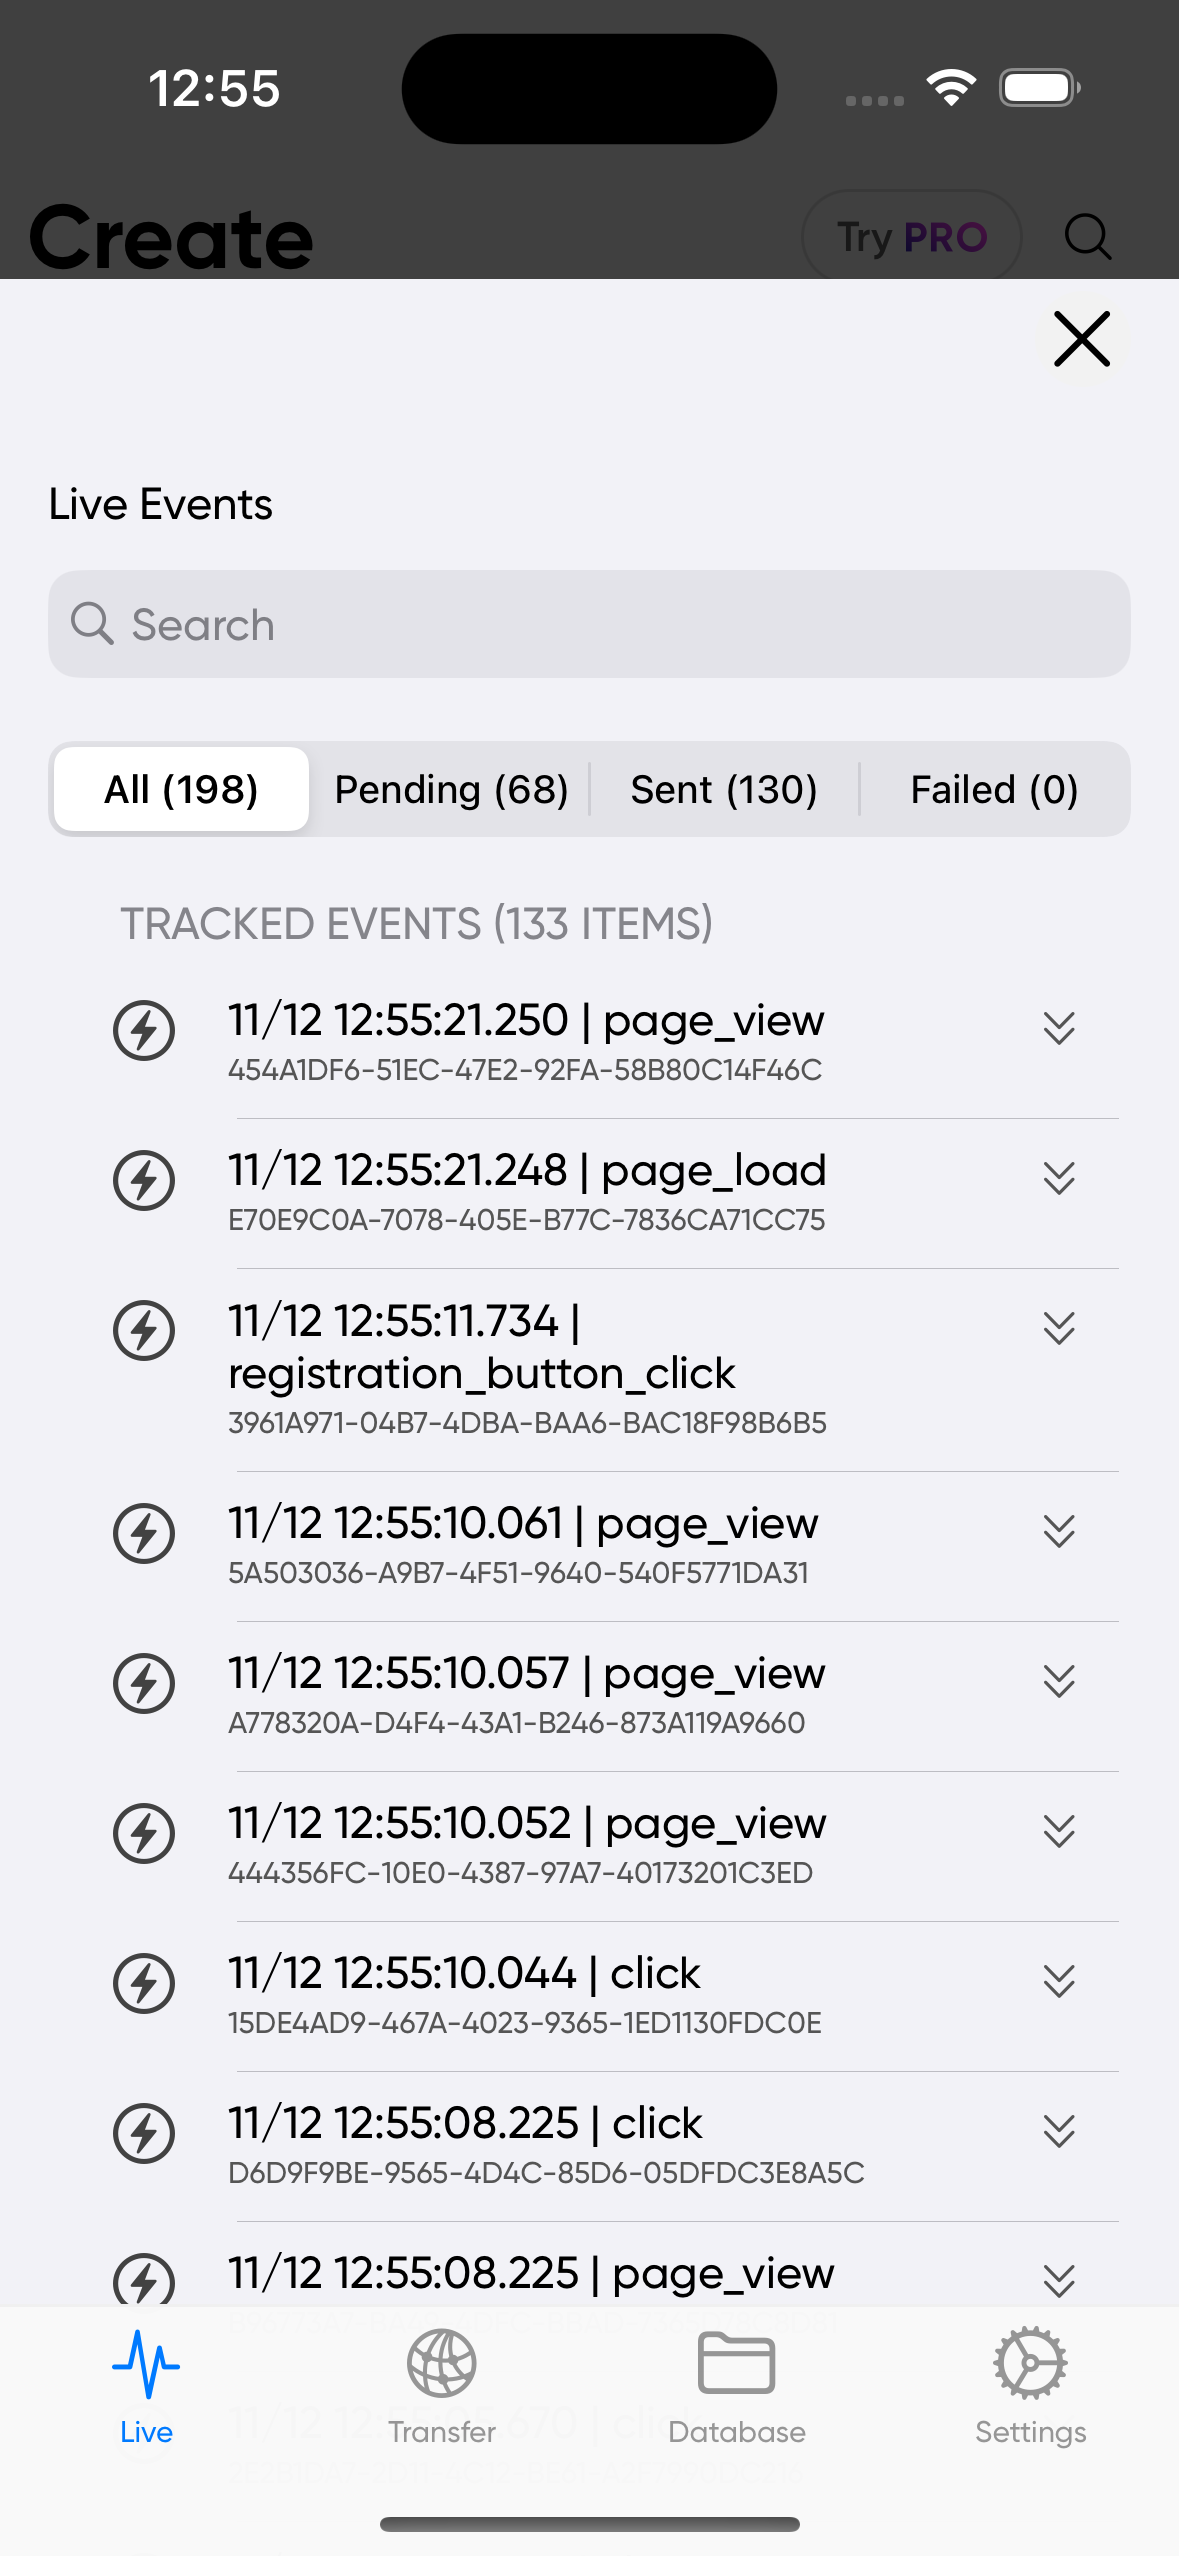
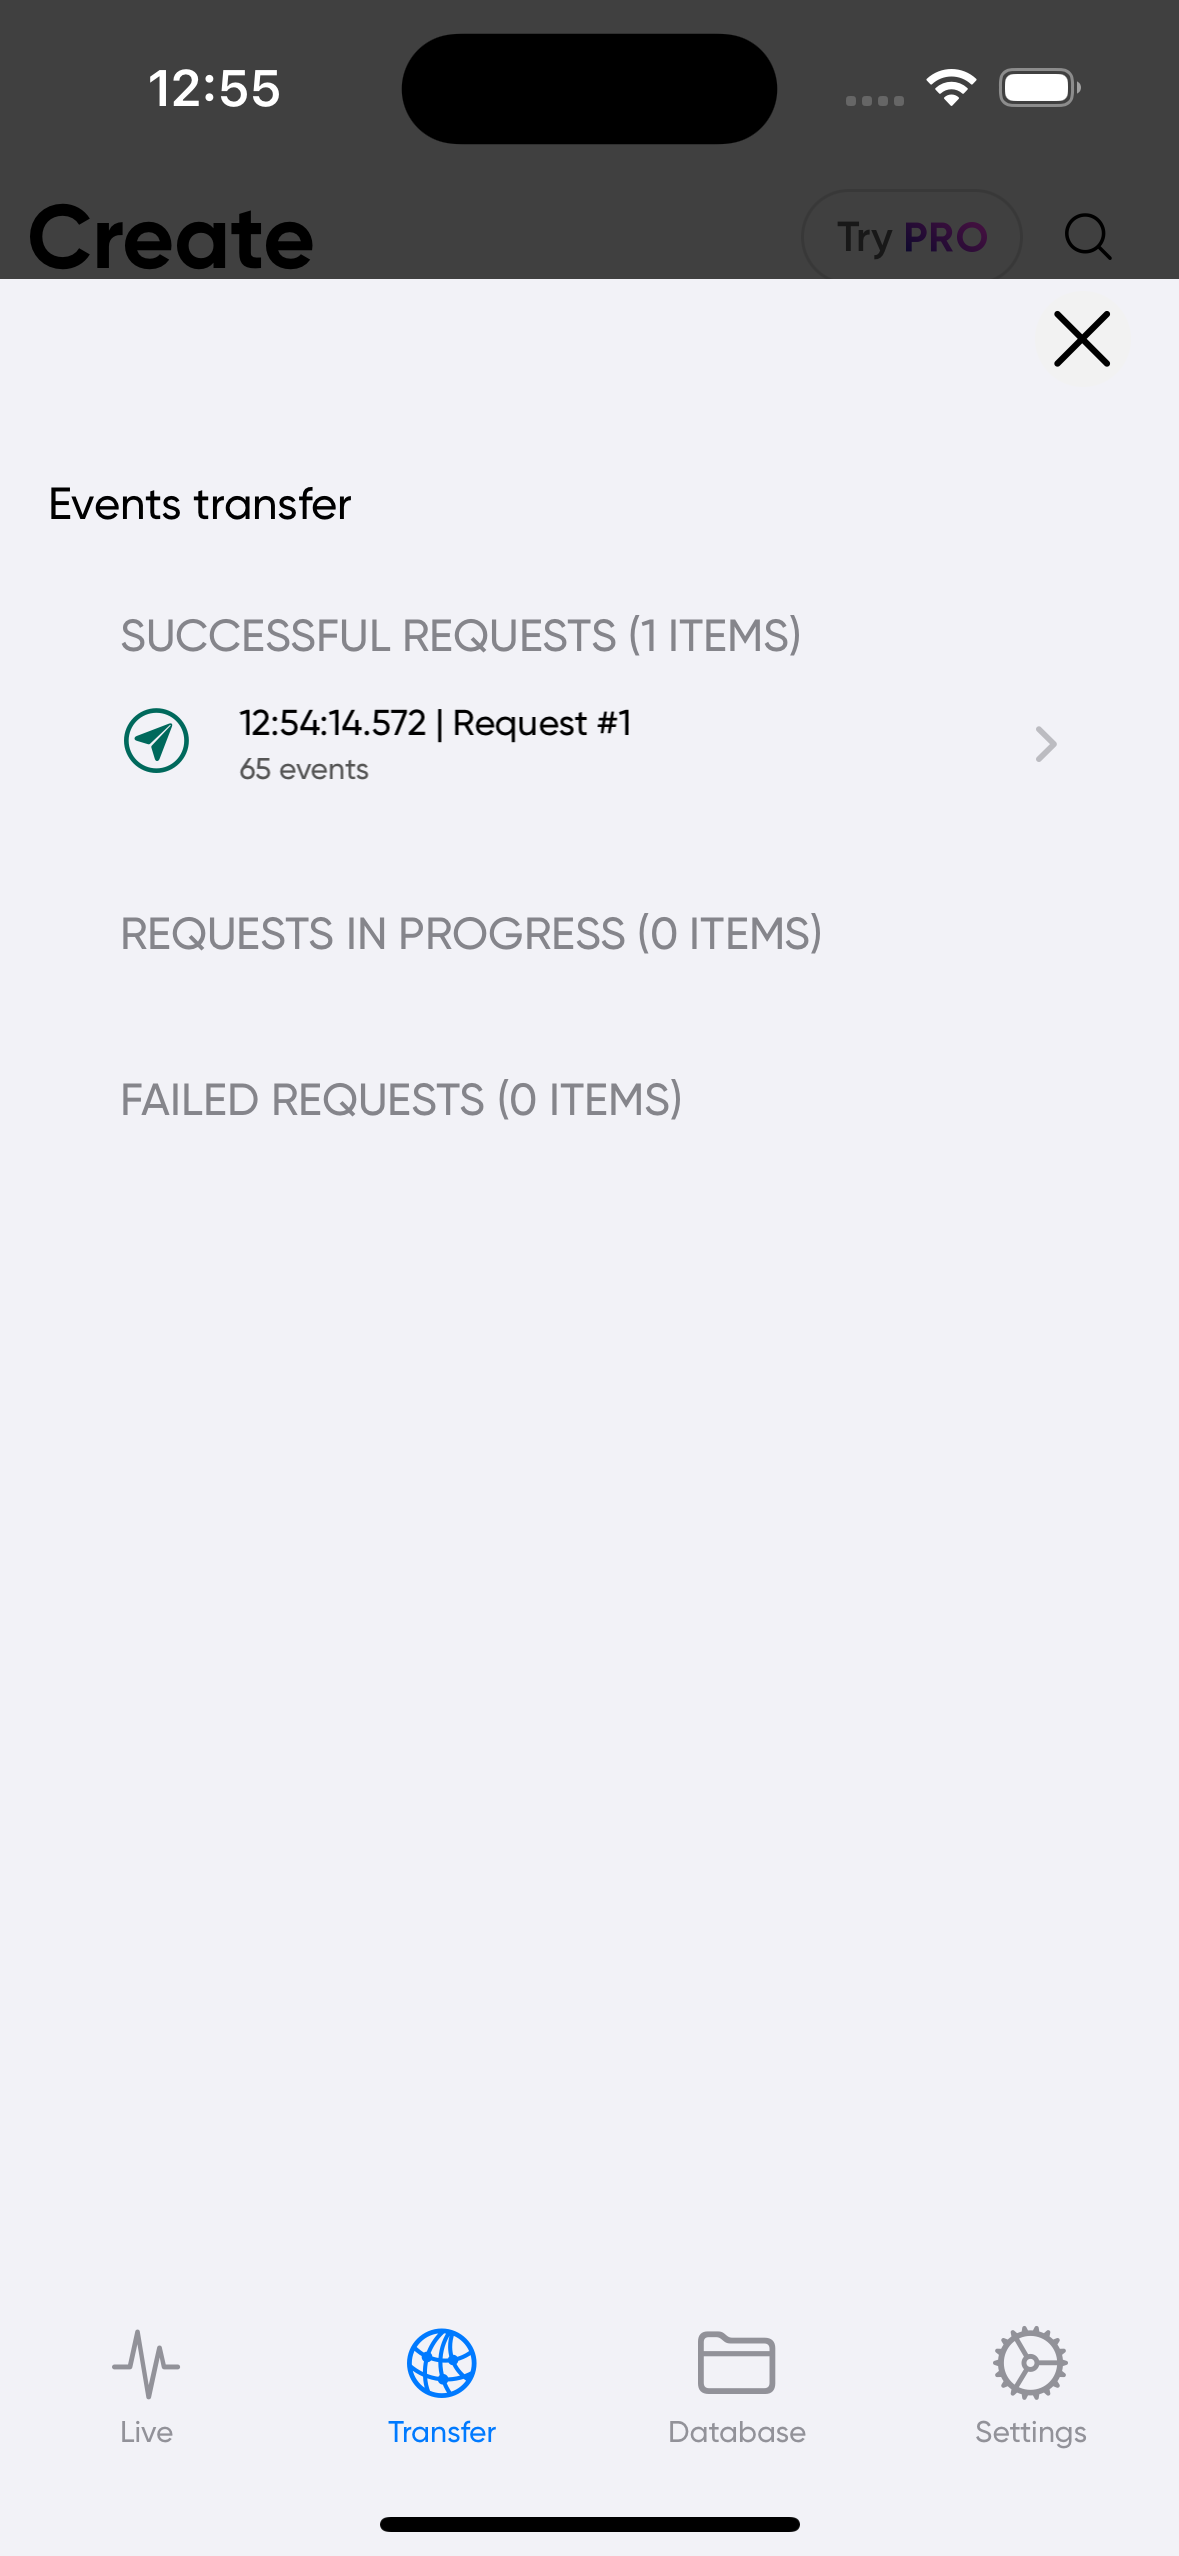
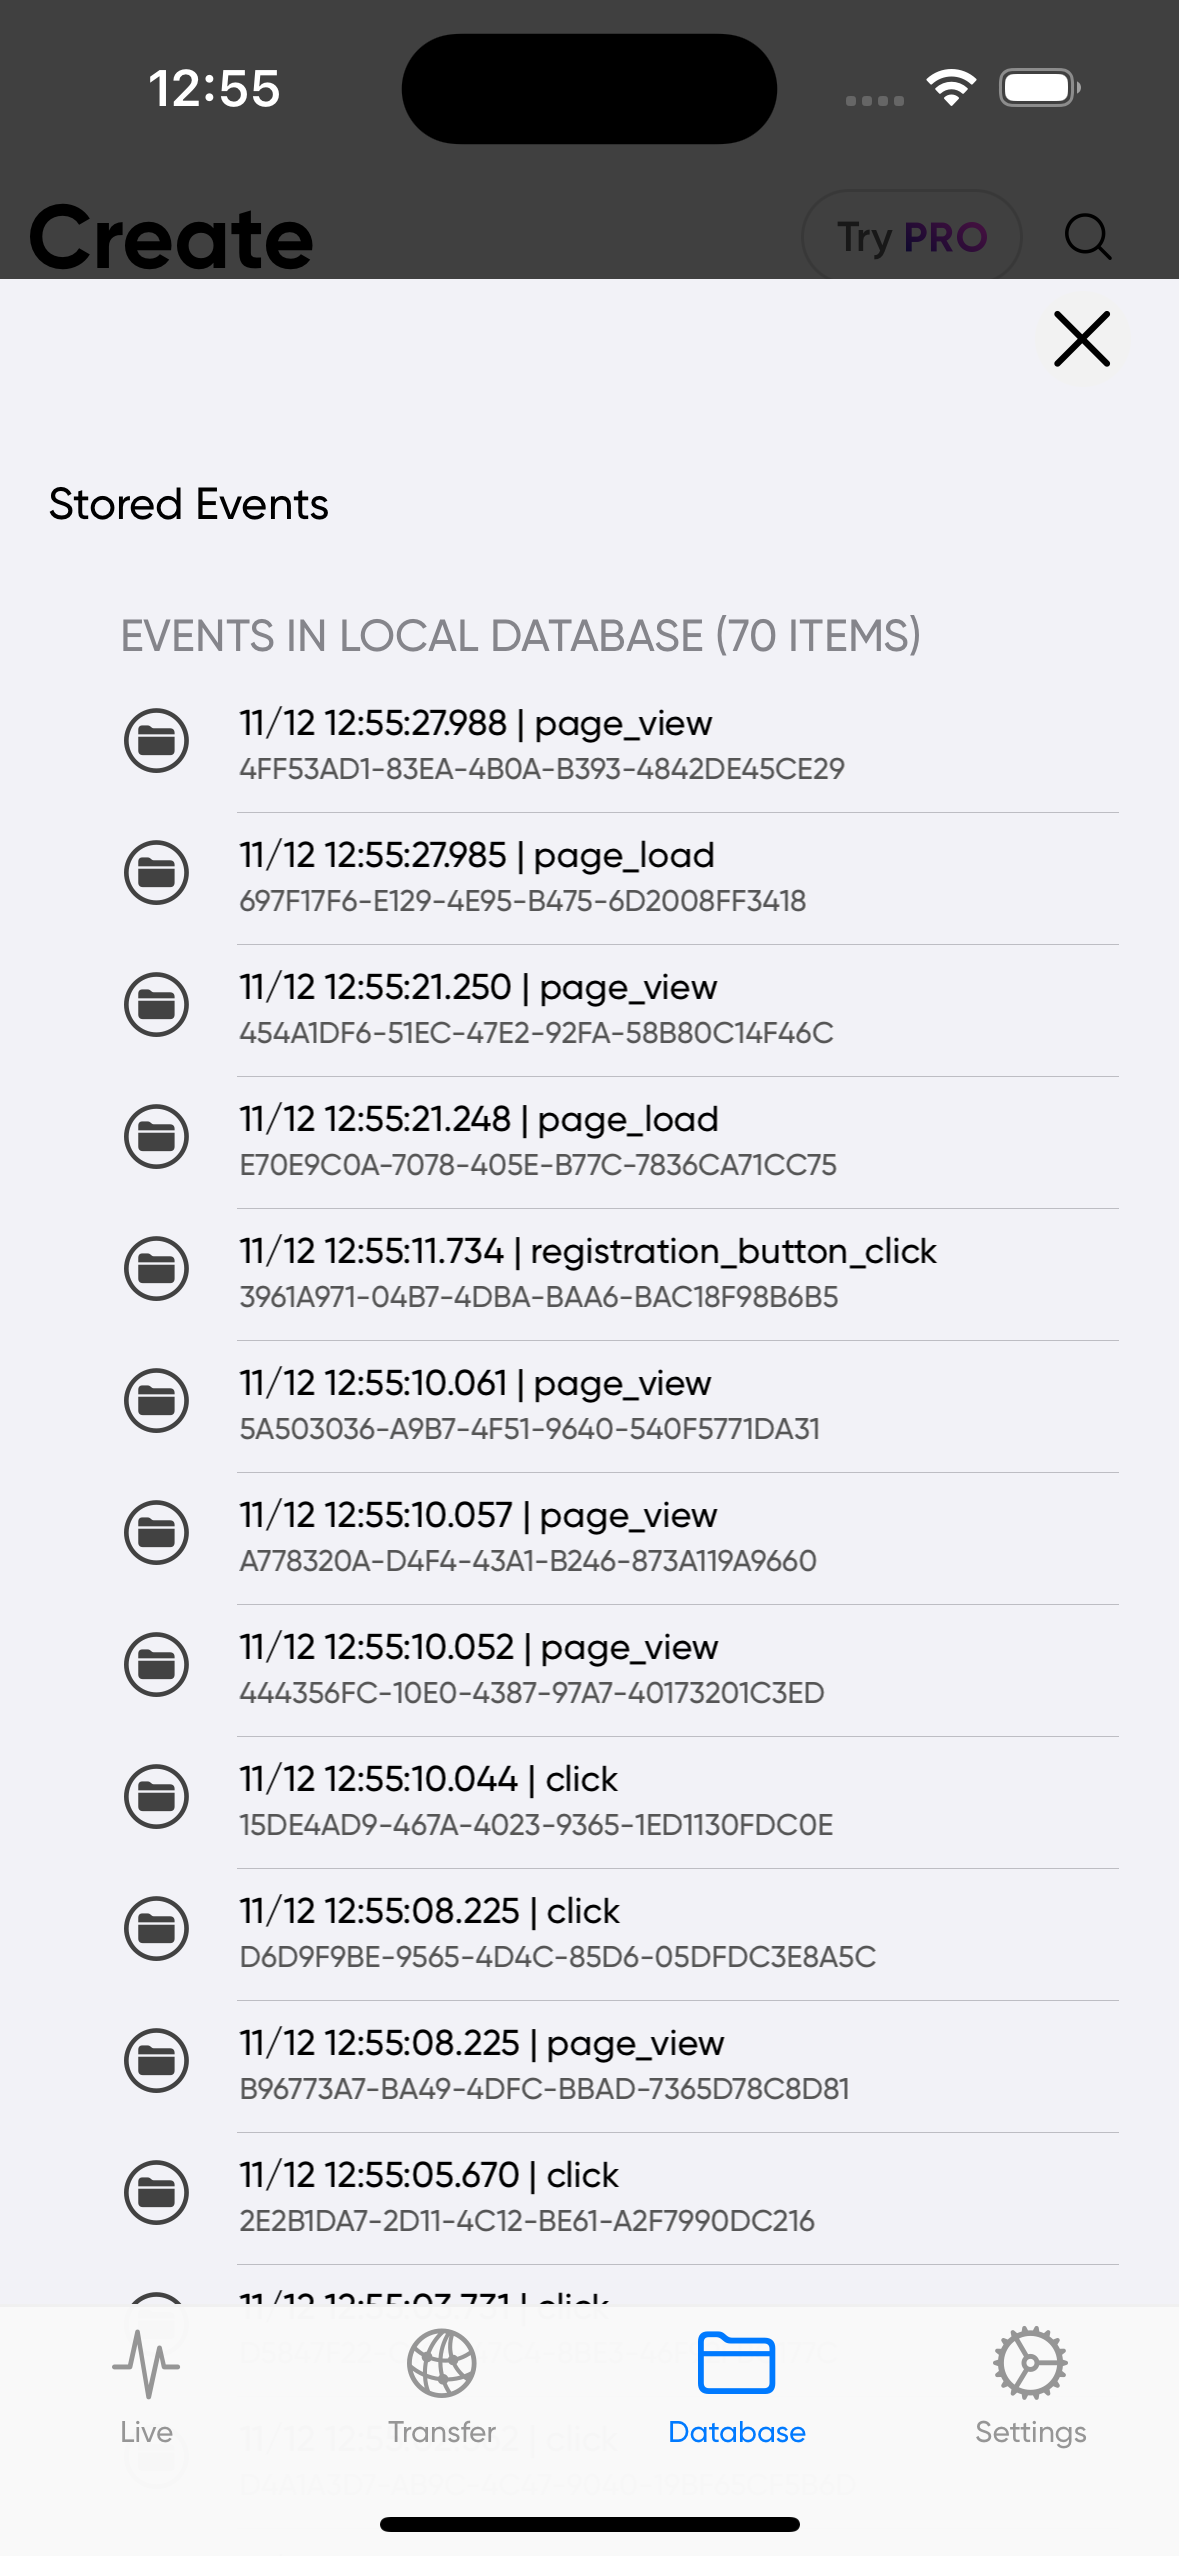
UI Events Monitoring Widget
The Analytics SDK includes a simple widget that overlays all views and enables monitoring of analytics events occurring in the system. In its collapsed state, this widget displays the following:
- Count of fired events
- Count of transferred events
- Count of events with warnings
- Count of invalid events (after backend validation)
By clicking on the widget, you can access detailed information about each event, such as its internal structure, fields, reasons for invalidation, and more. In its expanded state, the widget also provides access to the Analytics SDK settings, allowing you to modify the SDK's behavior at runtime. To manage the widget's visibility and monitoring mode, you can use the appropriate API calls provided by the Analytics SDK.
PAAnalytics.configSet(trackingMonitoringEnabled: true, preferPreviousChoice: true)
 |  |  |  | 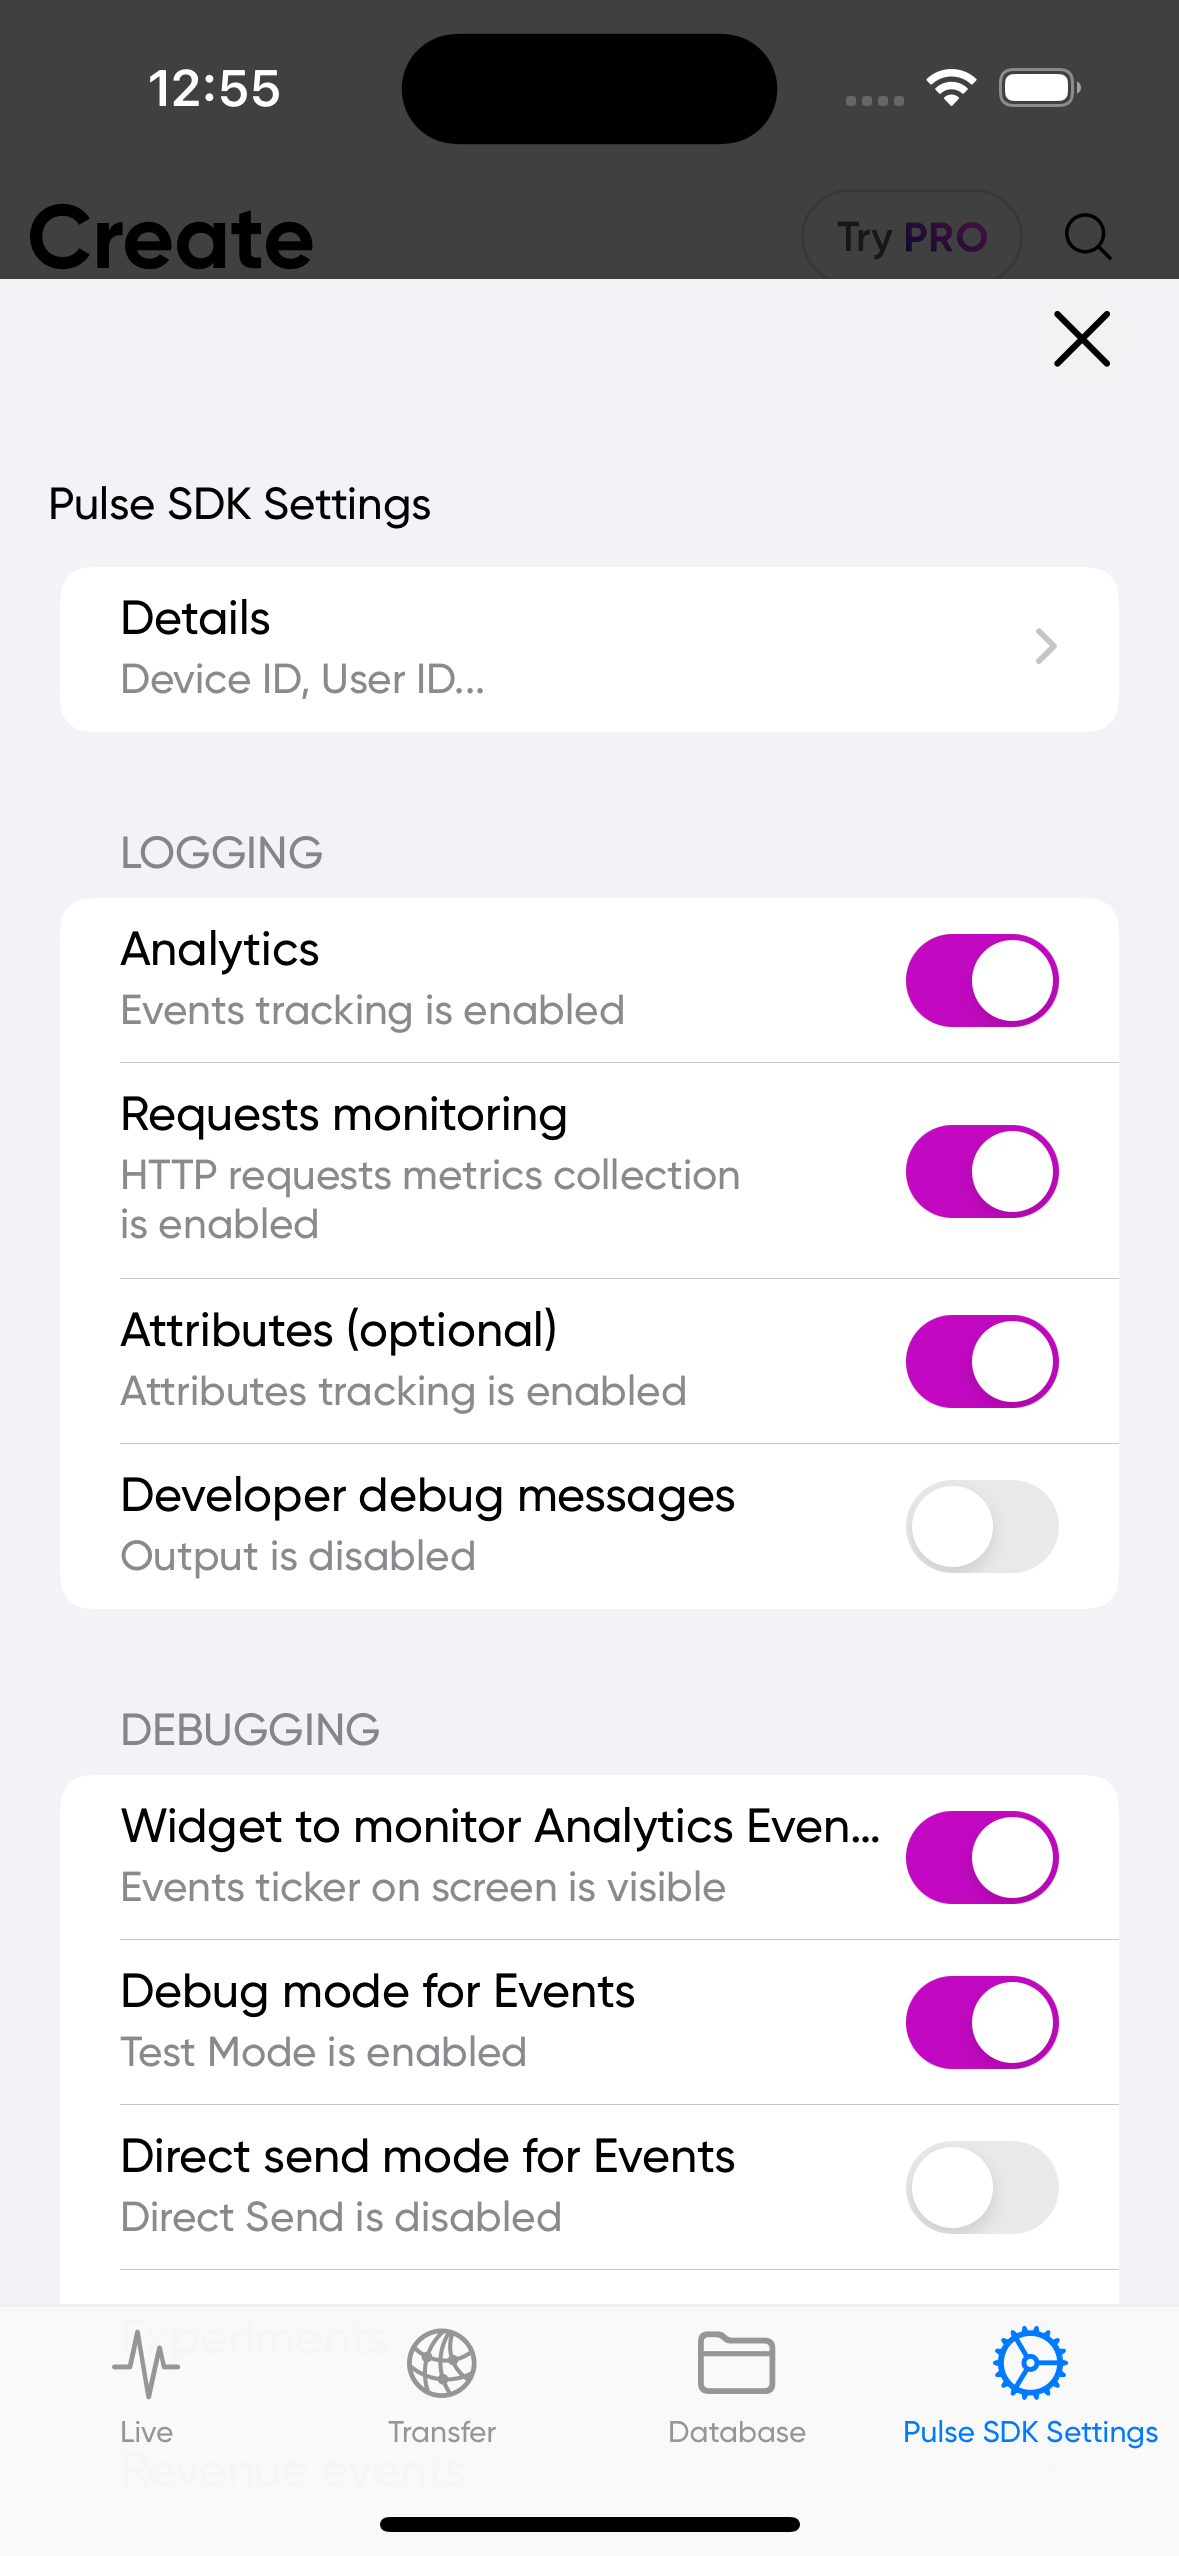 |
Please make sure this UI cannot be opened in production builds so your users can't see this UI. It's designed only for debuging.